Search Results for: intonation
Aligning & Gluing Bridges
Aligning and gluing bridges
The correct placement and gluing of a bridge to the top of an instrument is one of the most important operations in building guitar family instruments. The bridge is one of the two primary attachment points for the strings. Further, the location of the bridge and saddle control the basic intonation of the instrument. So it’s clear that we want to put the bridge in the right place and make sure that it stays there.
We have elsewhere discussed the problem of String Compensation. Using this approach or one like it for a given set of strings, we can actually measure the compensation string lengths for a given string set. If we always use the same brand and type of strings, then we can also make a template to help us locate the position of the saddle for an instrument of the same scale length and action.
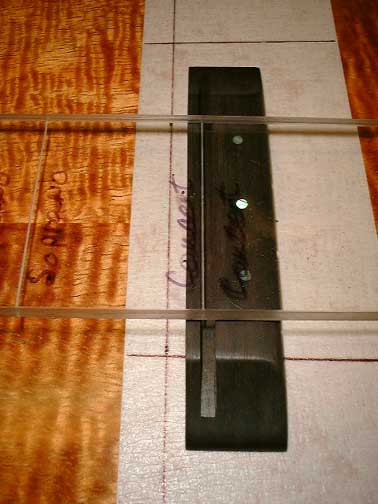
 The first picture shows the template that I’ve made for the various sized ukuleles and their associated scale lengths that I build. It’s Plexiglas, about 2″ wide, 1/4″ thick and 24″ long. For a guitar, I would probably make the length 32-36″. Because I use a zero fret, I’ve glued a little stop block on the left underside of the template. The stop block rests against the headstock side of the zero fret when the bridge is being positioned.
There are four different position lines scribed into the underside of the template: one for each different size of ukulele that I make. The distance of each scribe mark represents the shortest compensation length for each string set; this line will mark the front edge of the saddle.
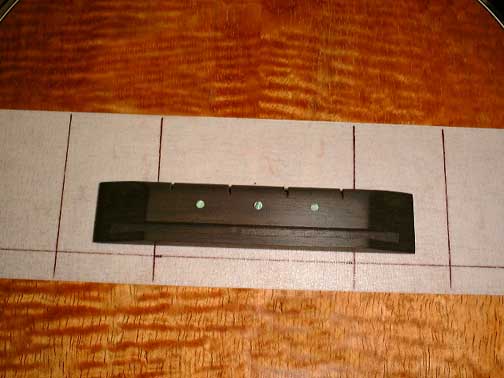
We’ll first use the template to figure out where to put the masking tape. Place the bridge on the ukulele or guitar just below the soundhole. This is not its eventual location; we’re just using the bridge as a temporary rest for the template to hold it above the top of the guitar. Now put the template in place with one end keyed to the headstock end of the fretboard. Note where the compensation scribe mark is for the scale length of the instrument you’re using. Take a piece of 2″ wide masking tape slightly longer than the width of the instrument, and position it on the top so that the upper edge of the tape is about 3/8″ above the scribe mark. Now move the bridge down so that the scribe mark is above the front edge of the saddle channel. There should be an approximately equal amount of tape above and below the bridge if the tape is placed correctly as in the figure above. If not, gently remove the tape and reposition it.
What we’re going to do now is to make a set of position lines; one set will be parallel to each side of the fretboard, the other will be parallel to the frets. The figure on the right shows a 1″ wide ruler placed against the edge of the fretboard. With a pen like a fine point Sharpie, draw lines on the tape on both sides of the ruler, being careful not to damage the finish by pressing too hard. Repeat this operation for the other side of the fretboard. Now again with the ruler against the side of the fretboard, measure a distance from the 12th fret to a point on the tape that will end up being about 1/8″ in front of the bridge when it’s in its final position. You’ll need to use the template to approximately position the bridge to do this. Repeat this for the other side of the fretboard.
 The figure on the left shows a view of the bridge in place with its associated orientation lines. The lines parallel to the edges of the fretboard allow the builder to center the bridge on the top relative to the center line of the fretboard. The line in front of the bridge allows orientation of the saddle channel when the template is in place.
The right hand figure shows the template in place above the bridge with the scribe line at the front edge of the saddle channel.
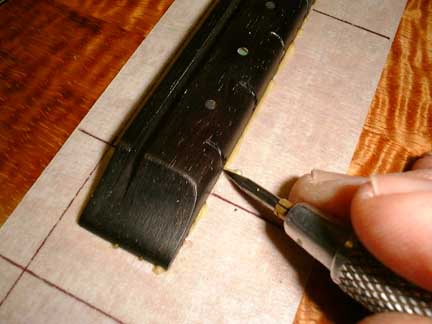
The template is now carefully removed and with the bridge held firmly in place, the perimeter of the bridge is traced with an Exacto knife. The bridge and tape rectangle are removed.
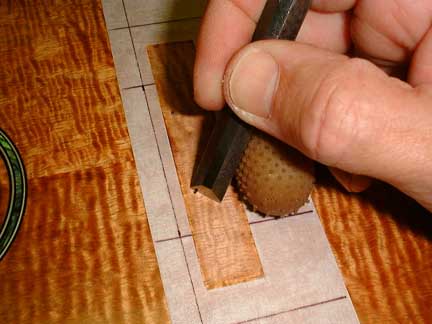
Using a very sharp 3/8″ chisel, I then scrape the finish away to bare wood, leaving a 1/32″ border around the inside of the tape. Note that the chisel is held diagonally to the grain in order to reduce tearing of the wood (and tears from the builder…). The tape next to the bridge footprint is gently but firmly smoothed with the back of your fingernail to reduce the likelihood of glue going underneath it.
At this point, I wax the bridge using Meguiars #16 non-silicone car wax. Waxing the bridge makes for much easier glue removal later on. Let the wax dry, then buff lightly with an abrasive pad. Lightly re-sand the bridge bottom if any wax got on to that surface.
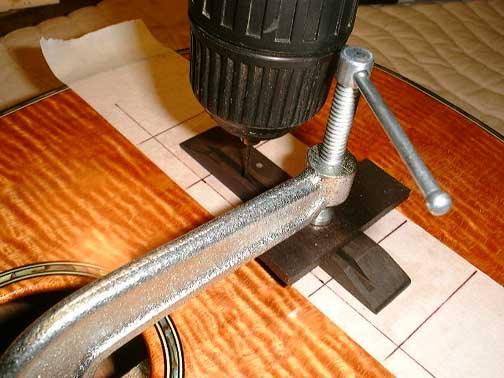 It is now necessary to drill holes in the saddle channel for positioning pins. This is an irksome job, but the alternative is having the bridge slip around during and after the clamping process. Given that it is undesirable to drill through one of the braces, determine where the braces are by feeling around with one of the clamps to be used in the gluing process. Use a pencil to mark in the saddle channel where the edges of the braces are and then drill small holes 1/8″ or so to the side, away from the brace. I use little brads as positioning pins but others use little dowels or even toothpicks. For me, the smaller the hole, the easier the process is, so brads it is. If the drill bit is a little smaller than the brad, no problem. Just nip off the head of the brad and use the brad to enlarge the hole that the drill bit has made. In the picture to the right above, you will notice that the bridge is being clamped during the process of drilling through the top. This is necessary. I usually use a drill press to drill through the saddle channel, then a portable drill to drill through the top when the bridge is aligned. The tips of the brads are not uniform, so I file the ridges off the little chiseled faces to make it easier to put them in the alignment holes.
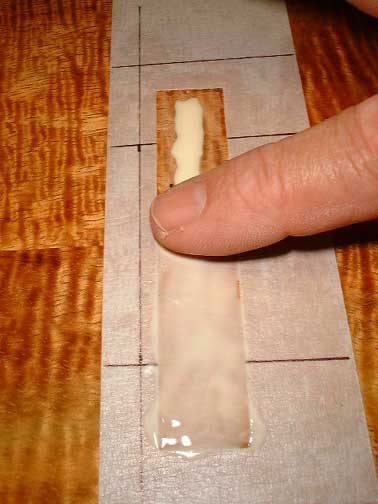
The figure left shows my perfectly manicured digit goobering up the bridge footprint with Titebond glue. One of the alignment holes is just visible (dark dot) above the center of my fingernail.
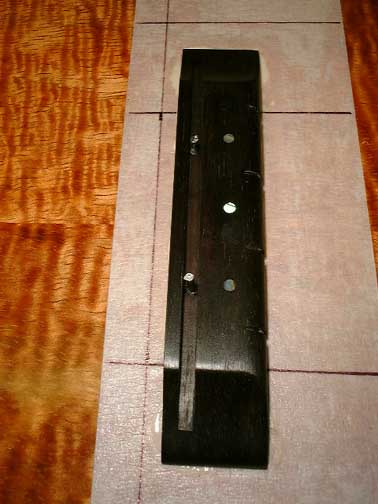
The figure to the right shows the bridge in place with the two alignment brads. I usually wax the brads before insertion for easy removal later.
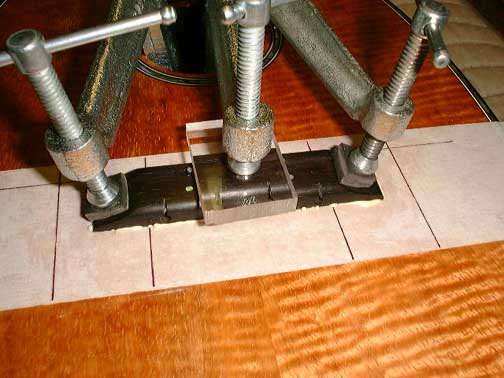 The figure above left shows three clamps in place with good glue squeeze out all around. Titebond recommends 15-30 minutes clamping and I do about 25 minutes. Better to err on the side of caution. I’m using a Plexiglas caul just slightly off center for the middle portion of the bridge and 1/4″ thick Neoprene rubber pads for the ends. You must use as many clamps as possible to make sure of a proper and even gluing pressure as discussed in the Glue Clamping page.
Depending on your humidity conditions, the glue will be ready to remove about 30-90 minutes after the gluing process has begun. The glue should have skinned over and become slightly translucent. Gently pick up an edge with some sort of pointed tool and try to peel it along the bridge-tape corner. Often a piece an inch or more will come up. Tweezers are useful at this point. You may find some soft glue underneath; allow it to dry and repeat the process. When all the readily removable glue is gone, pull up the tape. I do this my pulling the outer edge vertically until I’ve reached the middle of the bridge and then repeat the process from the other end of the tape. The bridge may have become slightly cloudy from where the glue was. Just re-tape next to the bridge and touch up with the abrasive pad you used to polish it with after you applied the wax. Wait a day before putting the strings on…
If you enjoy the technical side of things, please consider buying my book “Left-brain Lutherie” . which you can buy directly from me.
I enjoy writing these pages and hope that they are interesting and useful to the reader. I’ve stopped building at this time and still need to generate some income in order to continue to expand this website with more useful articles. If this page was helpful to you and you would like to make a $5.00 donation in order to have more pages like it, please use the donation button below. Thank you.
String Diameter Variability and Frequency Response
Estimating the effects of string diameter variability on string frequency response
If you enjoy the technical side of things, please consider buying my book “Left-brain Lutherie” .
Recently I had a “problem solving opportunity” when a customer brought in one of my 8-string tenor ukuleles in order to resolve an intonation problem. According to the customer, neither of the unison pairs of (440 Hz) A or (329.6 Hz) E strings would intonate correctly, with the unison A pair causing the most difficulty. That is, beginning at around the 10th fret the first string became noticeably sharper than the second string. The second pair was also described as “not quite right” also. The customer has a very good ear for detecting such differences and even I could hear them. Since the saddle was in its customary location and I was using Savarez Alliance medium tension trebles for these string courses, I was somewhat puzzled as to what the problem was. That is, I had previously had no poor intonation comments from customers with this particular saddle compensation and these good quality strings. Ah, grasshopper…
Thinking that since the unison pairs were only ~2 mm apart, saddle geometry couldn’t be causing the ~10 cent frequency difference, I began to check the string diameter every few inches along the length of the string, while the string was under tension. Distance in Table 1 refers to the distance from the zero fret. Table 1 gives the results of my measurements for both the A and E strings.
Table 1. Location and measurements of differing string diameters
Meas. location
Distance, inches
String#1
String#2
String#3
String#4
1st fret
1.0
.572
.573
.656
.652
3rd fret
2.75
.575
.575
.657
.654
5th fret
4.25
.576
.575
.654
.654
7th fret
6.6
.570
.575
.657
.656
10th fret
7.5
.571
.574
.658
.657
12th fret
8.5
.570
.572
.658
.656
15th fret
9.9
.568
.575
.656
.657
20th fret
11.4
.570
.575
.658
.657
Top soundhole
13
.568
.571
.659
.658
Bot. Soundhole
15
.565
.579
.660
.658
Near saddle
16.8
.569
.575
.661
.658
Figures 1 and 2 show these same data in order to have a more visual feeling for the diameter changes. One set of straight lines connects the data points for each string, while the single straight line through the group of points representing each string are linear regressions estimated by the Excel algorithm for that data grouping.
Figure 1, giving data for the unison pair of 440 Hz A strings
Figure 2, giving data for the unison pair of 329 Hz E strings
It’s clear that the string diameters are not constant, nor are any of the trends horizontal as they should be. But the actual changes involved seemed small to me and I wondered if I could calculate what the effects of these varying difference trends on the string frequency of fretted notes might be.
I began with the string formula:
f = (2L)-1 * (T/m)½
where f is frequency in Hz, L the string length, T the tension, and m the mass of the string per unit length. Since my goal was to compare the upper and lower halves of the string to one another in order to determine the effect of diameters on string frequency, I rearranged (1) to solve for T:
T = m * (f *2L)2
Since the tension for both halves of the string is the same, we can set the right hand side of the equation for each half of the string equal to the other:
m1* (f1 *2L)2 = m2 * (f2 *2L)2
where m1, f1 refer to the upper portion of the string near the headstock, and m2, f2 refer to the lower half. The “2L” terms on both sides cancel. We rearrange once more and have:
(m1/m2) = (f2/f1)2
But we measured diameters not mass per unit length. So now what? We can obtain mass by dividing density by the unit length volume. And we obtain the unit length volume by using the formula for the volume of a cylinder:
V = pi * h * r 2
Where pi is 3.141728…, h the unit length and r the radius of the string. And since r = ½ * d, the diameter, then we have:
(m1/m2) = (dens. * pi * h1 * .5 * d12 )/ (dens. * pi * h2 * .5 * d22 )
The density, pi, h and 0.5 terms cancel so now we have
(m1/m2) = (d1/d2) 2
So now we can look at our fourth equation in terms of string diameters instead of string mass per unit length:
(d1/d2)2 = (f2/f1) 2
The square terms cancel and we have the remarkably simple result:
(d1/d2) = (f2/f1)
That is, the ratio of the average “upper half” string diameter to the average “lower half” string diameter gives the ratio of the “lower half” string frequency to the “upper half” string frequency.
Since the customer worried about intonation near the mid string point, let’s look at string frequencies for the A and E strings in that region. The A frequency will be set at 880 Hz and the E frequency at 660 Hz for calculation purposes. Since most frequency meters give readings in cents or hundredths of an interval we need to go from Hz to cents in these regions. A semitone interval in the 880 Hz region is ~50 Hz and that in the 660 region is 38 Hz. So there are (100/50) 2 cents/Hz in the 880 Hz region and (100/38) 2.63 cents/Hz in the 660 Hz region.
The order of operations is as follows:
Calculate the average diameter of the string in each half of the string by summing the measurements for that half and dividing by the number of measurements.
Divide the upper string half average by the lower string half average to obtain the ratio of the lower string half frequency to the upper string half frequency.
Multiply the ratio times the string midpoint frequency and then subtract the midpoint frequency from the result.
Multiply the answer in 3. by the cents/Hz ratio for the frequency range in question.
Table 2 gives calculation results.
Table 2. Calculation results for frequency differences
String#1
String#2
String#3
String#4
Upper string av. Diam.
0.572
0.574
0.657
0.655
Lower string av. Diam
0.568
0.575
0.659
0.657
(lower/upper) freq. ratio
1.00704
0.999
0.997
0.996
Frequency @ 12th fret
880
880
660
660
Ratio * frequency, Hz
6.2
-0.8
-2.0
-2.5
Ratio diff. cents
12.4
-1.5
-5.3
-6.6
How do we interpret the results of the last row of figures? First of all, we need to think of the ideal case, where the diameter of the string is constant throughout. In this case, the frequency ratio in row three of Table 2 is unity, and if the saddle is in the right place, the 12th fret harmonic and 12th fret fretted note will be the same. Of the four strings in Table 2, string# 2 comes closest to this situation.
But if the average diameter of the lower half of the string is smaller than the upper half as in string#1, then the notes of string#1 will be progressively sharper relative to string# 2. Why? The string formula (equation 1) shows us that mass per unit length is inversely proportional to frequency. That is, as string mass per unit length decreases (at constant tension and string length) frequency increases. Since mass per unit length and string diameter are both directly proportional to one another (at constant density), a smaller diameter equates to a higher frequency. As you move up the fretboard toward higher notes, the active string average diameter of string# 1 decreases both compared with its own upper half as well as the active string average diameter of string# 2. The notes of string#1 play sharper and sharper relative to string#2.
The case of string# 3 and string#4 is a little more subtle but equally irksome. The diameter trends of both strings are roughly parallel and not greatly disparate, so both will sound similar to one another as you move up the fretboard, but both will also will play progressively flatter because of the increasing average active string length diameter. Even if the saddle is in the correct position for a string of constant diameter, the fretted 12th fret note will be flat ~5 cents compared to the 12th fret harmonic.
What to do? I admit to being in a quandary. My customers and I really like the sound of the Savarez Alliance strings, but it’s clear that quality control of string diameter is a serious issue for the player with a keener ear. The Savarez Alliance strings are not trued (ground to constant diameter); I’m now on the lookout for strings that are both trued and have that great Savarez sound. Any suggestions?
If you like the types of problems discussed in this page, please consider being a participant in the LEFTBRAINLUTHERIE mailing-list. The list is now being managed by Australian luthier Jeremy Locke and is available at:
leftbrainluthiers@yahoogroups.com
I enjoy writing these pages and hope that they are interesting and useful to the reader. I’ve stopped building at this time and still need to generate some income in order to continue to expand this website with more useful articles. If this page was helpful to you and you would like to make a $5.00 donation in order to have more pages like it, please use the donation button below. Thank you.


Left-Brain Lutherie Book
Left-Brain Lutherie — Using Physics and Engineering Concepts for Building Guitar Family Instruments: An Introductory Guide to Their Practical Application
After 20 years, we finally have to increase our book “Left-brain Lutherie” to $65.00 plus shipping to account for the ~65% increase in the cost of living over that time period. Shipping charges within the United States will remain the same for 2024, but shipping charges for outside the United States have increased.
Because of the increasing number of computers which no longer have CD drives, weʻre replacing the CD with an 8 GB USB drive to hold the extra 80 files which come with the book.
Please use the first button below for shipping within the USA
About this book…PLEASE READ CAREFULLY.
Please use the this second button below for shipping outside the USA ( Canada, Japan, Korea, Europe, etc.)
About this book…PLEASE READ CAREFULLY.
This is not a step-by-step manual for making an ukulele or guitar from beginning to end. Please don’t buy this book if that’s the only kind of information that you’re looking for.
This book is about using physics and engineering concepts as they are actually applied to instrument building during and after the building process. If you have already built several instruments and want more consistency, better mechanical stability and a deeper understanding of the effects of string load on your instrument (and many other subjects as well), this is the book for you.
I believe that if you take the time to read and think about the information herein and practice using the spreadsheets to understand more about your wood and building, that you will be considerably more consistent with respect to the type of sound you wish to achieve and the long-term stability of the instrument as well.
There is a lot to think about in the book and it may take some time to become comfortable with some of the calculations. In all honesty, it took me a fair amount of time to research and write the book since I am not facile in either physics or mathematics. Please be patient and take the time to work through the different problems and spreadsheets. In the end, I’m sure that both improvement and understanding will result.
In the following chapters, I apply introductory physics and technology to instrument making in a manner which can be used and tested by anyone with a knowledge of high school mathematics, a home computer and a few easily obtained or constructed instruments. I show experimental setups in sufficient detail so that those reading this book can duplicate and extend these studies. These setups are as simple as possible while maintaining an adequate level of accuracy and precision for the experiment at hand. For example, the top deflections studies only require a piece of 2”x4”, a moderately sized piece of plywood for the base, several different sized PVC pipe fittings, an inexpensive dial micrometer, a foot long 1/4” diameter metal rod, some calibrated weights (I used fishing sinkers), small wood scraps and the wooden plates of interest – hardly a room filled with $10,000 worth of science equipment.
I have tried to make the format of the book practical and readable:large pages, 24 lb stock paper for durability, relatively large print, a spiral binding so that the book can lie flat on a workbench or beside the computer without effort and a CD containing both spreadsheets for data manipulation / analysis and many color images of physical measurement setups.
Join the other lutherie literati and combine the left and right halves of your brain for instrument making…8)
To contact me by e-mail, please send to:
aloha,
David “Kawika” Hurd, Hilo, Hawaii 2020
TABLE OF CONTENTS
Tables ……………………………………………………………………………..x
Figures …………………………………………………………………………… xii
List of Principal Symbols……………………………………………………. xviii
Introduction……………………………………………………………………… 1
Chapter 1 Nylon String Guitar Family Sizes and Tunings…. 3
A Description of the Nylon String Guitar Family Instruments………………………….. 3
Common Ukulele Tunings……………………………………………………………………….. 3
Body Size and Air Resonance – an Introduction…………………………………………… 5
String Tension and Body Size…………………………………………………………………… 5
Chapter 2. An Overview of Some Building Issues……………… 8
Which of the guitar family instruments do you wish to build?…………………………… 8
What are the scale length and materials of the strings?…………………………………… 8
What are the dimensions and properties of the front, back and sides?………………. 8
What type and pattern of braces should the front and back have?…………………… 9
Depending on the bracing pattern, how mechanically stiff should the top be?……… 9
Avoiding “dead spots” on the fingerboard…………………………………………………… 10
What are the general dimensions of the neck and fretboard?………………………….. 10
Is the bridge the right size and in the right place?………………………………………….. 10
What are the right combination of temperature and humidity conditions?…………. 11
Chapter 3. Looking Ahead: Creating a Top Deflection Model. 12
Chapter 4. The Top Deflection Model……………………………… 14
Calculating String Tension……………………………………………………………………….. 14
Creating a Model for Estimating Torque on the Bridge………………………………….. 15
Introduction to the Problem………………………………………………………………….. 15
The Gallagher Model……………………………………………………………………………. 15
Sample Calculation………………………………………………………………………………. 16
The Licis Model……………………………………………………………………………………. 17
Sample Calculation………………………………………………………………………………. 21
Validation of the Bridge Torque Models………………………………………………….. 21
An Additional Downward Force on the Bridge………………………………………… 24
Top Deflections for Torques, Thickness’, Size and Material Properties……………. 25
Description of Methods for Wood Properties Measurements…………………………. 33
Conditions for measurement for wood properties…………………………………….. 34
Properties to be Measured…………………………………………………………………….. 34
Choosing Wood for Instrument Building and Property Measurement…………. 35
Measuring Density……………………………………………………………………………….. 36
Static Determination of Elastic Moduli………………………………………………….. 36
Dynamic Determination of Elastic Moduli………………………………………………. 40
A Simple Experiment Dealing with the Static Deformation of a Fixed Plate.. 42
Measuring the Average Modulus of Elasticity for a Plate…………………………. 44
Vertical Compliance versus Lateral Torque Deflections – Validating Eave……. 47
Testing the Model for a Variety of Woods, Thicknesses and Sizes………………….. 49
Experiments Relating Samples Having Different Values of Eave…………………. 50
Experiments Dealing with Samples Having Different Thicknesses and Radius….. 51
Calculations Involving All the Predictive Variables…………………………………. 53
Creating a More General Deflection Model………………………………………………… 55
Beginning of the Braced Disk Discussion………………………………………………… 55
An Aside Regarding the Display of the Deflection Map…………………………….. 56
Continuation of the Braced Disk Discussion……………………………………………. 57
Comparison of Torque Curves for Braced and Unbraced Disks………………… 58
Changes in the Model Resulting From Installing a Crossbrace………………….. 60
Generating Apparent Thickness and Eh3 Maps………………………………………… 64
Adjusting the Calculations for Elliptically Shaped Lower Bouts………………… 69
Top Deflection Under String Load From Compliance Measurements…………. 70
Chapter 5. Testing the Models and Suggestions for Building73
Royal Hawaiian, 4-string soprano ukulele, ca. 1920’s vintage…………………… 73
Martin 4-string soprano ukulele, ca 1920’s vintage………………………………….. 76
Kawika, 4-string tenor ukulele, 1997……………………………………………………… 79
Gibson TU-1, 4-string tenor ukulele, ca 1930’s vintage……………………………. 82
Kenny Hill Palo Escrito #3027 Classical Guitar………………………………………. 85
Ramirez R31993 Classical Guitar…………………………………………………………… 88
Summary of Guitar Family Examples: Measured & Calculated Properties… 95
Calculating Midpoint Mechanical Compliance Ranges for a Given Instrument… 96
Choosing Mechanical Compliance Maps for a Given Instrument………………. 99
Chapter 6. Resonance Coupling………………………………………. 101
Appreciating and Utilizing the Work of Jurgen Meyer…………………………………… 101
A Statement of the Problem………………………………………………………………….. 101
Measuring the Helmholz Resonance for Guitar Family Instruments…………… 101
Measuring the Top and Back Resonant Frequencies during Construction…… 102
A Listing of the Resonant Frequencies Studied by Meyer………………………….. 102
Relationships Among the Resonant Frequencies Studied by Meyer…………….. 104
Using Spreadsheets Based on Meyer’s Data……………………………………………….. 108
Forward Modeling — Trying to make an instrument with a particular resonant frequency ratio 108
Reverse Modeling — Trying to copy an instrument with a particular set of final resonance ratios 111
An Empirical Approach for “Optimal” Top and Back Coupling………………………. 114
The “Problem” of the Bass Response…………………………………………………………. 115
Chapter 7. Calculating Neck Deflection…………………………… 117
Variables and Equations in the Spreadsheet……………………………………………. 117
Derivation of the Neck Deflection Equation……………………………………………. 118
Useful Auxiliary Data and Sample Calculations………………………………………. 119
Chapter 8. A Step-by-Step Approach to Optimizing the Body and Neck for Stability and Tone 123
Discussion…………………………………………………………………………………………… 124
Chapter 9. Other Topics in Instrument Building……………….. 126
Bridge Size, Placement and Gluing Considerations……………………………………….. 126
General Dimensions of Bridges……………………………………………………………… 126
Thoughts on Bridge Plates…………………………………………………………………….. 127
Bridge Gluing Considerations……………………………………………………………….. 128
Bridge Gluing Calculations…………………………………………………………………… 129
Temperature and Humidity Considerations…………………………………………………. 132
Statement of the Problem……………………………………………………………………… 132
Effect of Humidity Change on Wood Dimensions…………………………………….. 133
Stresses Created during Dimensional Change of Constrained Wood………….. 136
Discussion of Lutherie Implications………………………………………………………… 140
Thoughts on Bracing………………………………………………………………………………. 141
Effects of Brace Size and Shape on Stiffness……………………………………………. 141
Composite Braces………………………………………………………………………………… 143
Bracing Attached to Top or Back Plate…………………………………………………… 144
String Diameter Variability and Intonation Problems……………………………………… 146
Problems with Varying String Diameter…………………………………………………. 146
Measuring Instrument String Compensation………………………………………………… 151
Introduction and Description of Compensation Jig………………………………….. 151
Measurements and Discussion……………………………………………………………….. 154
Go-bars–Properties and Applied Forces…………………………………………………… 156
The Go-bar as an Example of Column Buckling………………………………………. 156
Testing Wood for Go-bar Use……………………………………………………………….. 157
Sample Calculations Using the Spreadsheet……………………………………………. 159
After Thoughts………………………………………………………………… 160
References…………………………………………………………………………. 161
Additional Sources of Information……………………………………… 163
The Internet……………………………………………………………………… 163
Periodicals……………………………………………………………………….. 163
Software Programs Used in this Work……………………………….. 164
Appendix 1…………………………………………………………………………. A
Additional Details of the Static Approach to MOE DeterminationA
Getting the Experimental Setup Ready…………………………………………………… A
How Big Should the Weight(s) Be?…………………………………………………………. C
General Measurement Procedure…………………………………………………………… D
How Accurately Should Each Parameter be Measured?…………………………… E
What About Cross-grain Measurements?………………………………………………… F
Appendix 2…………………………………………………………………………. G
Additional Details of the Dynamic Approach for MOE Determination G
Getting the Experimental Setup Ready…………………………………………………… G
Measurements and Calculations…………………………………………………………….. I
Appendix 3…………………………………………………………………………. O
An Alternative Dynamic Approach for MOE Determination….. O
Appendix 4…………………………………………………………………………. Q
Description of Average E Determination for a Simply Supported Plate Q
Getting the Experimental Setup Ready…………………………………………………… Q
Measurements and Calculations…………………………………………………………….. Q
Appendix 5…………………………………………………………………………. S
Derivation of Thickness Comparison Formulae…………………… S
Derivation of Comparison Formulas……………………………………………………… S
Suggested Top Thicknesses for Nylon Stringed Instruments………………………. U
To explore more of the website, please refer to the Sitemap and Search Engine