Dynamic Measurement of Young’s Moduli: Part I: Ex, Ey and Ex,y
If you enjoy the technical side of things, please consider buying my book “Left-brain Lutherie” . Although no longer sold by StewMac, you can buy directly from me.
On another page we looked at how to measure Young’s modulus parallel to grain using deflection measurements. Herein I show a simple framework and some assorted electronic gear for the measurement of a wider variety of Young’s moduli. Analogous such systems have been described by Graham Caldersmith in The Catgut Acoustical Society and by Al Carruth in American Lutherie and by Tim White in the Journal of Guitar Acoustics. Additional reading would include “Fundamentals of Musical Acoustics”, Arthur H. Benade, Dover, 1990 (ISBN 0-486-26484-x). Don Bradley also makes and sells such a signal generator both through Luthier’s Mercantile and from his own company.
Figure 1. View of Frame without Sample 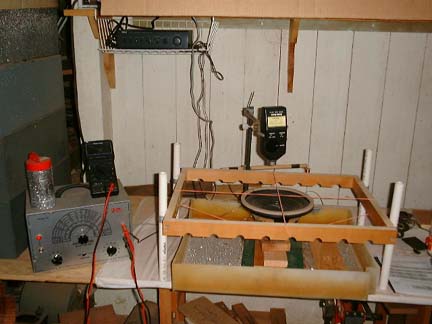
Figure 2. Frame Close-up 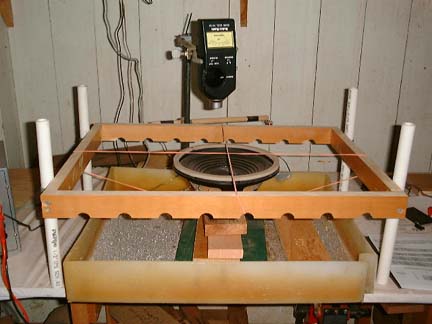 Figure 1 shows the same simple frame made of 1″x2″ fir, now turned upside down so that the notches are facing downwards and the frame is higher above the table surface. It is 22″ long and 16.5″ wide, but individuals should adjust the dimensions to fit their own needs. A Radio Shack subwoofer speaker (No. 40-1348A) is centered within the framework. One eighth inch rubber bands of suitable length support the wooden plate above the speaker. We will talk about the positioning of the rubber bands a little later.
Figure 2 shows a closer view of the measuring frame with the rubber bands in place and the speaker centered. Below the frame is a shallow container of some sort to catch most of the glitter that dribbles off the plate.
It’s important that the frame be level front to back and left to right. The four 1″ diameter PVC “legs” are held in place with galvanized pipe clips and short drywall or sheet metal screws for ease of friction adjustment. The speaker height should be adjusted so that the plate is just above the speaker when the plate is resting on the rubber bands.
Figure 3. Pictorial Schematic of Dynamic Young’s Modulus Measurement Setup  Figure 3 shows a simple schematic of the various electronic components. The signal of varying frequency comes from a signal generator (no surprise here…), is amplified by a Radio Shack amplifier (No. SA-155) and then goes to the Radio Shack subwoofer 50 watt speaker (No. 40-1348A). For greater accuracy in determining what frequency the signal actually is, a Radio Shack multimeter (No. 22-174B) is connected in parallel with the signal coming out of the signal generator. A further refinement for peak location is a Radio Shack sound level meter (No. 33-2050).
To find the various modes, I usually start around 50 Hz, sprinkle some Ben Franklin glitter in a light even coat across the plate and slowly increase the frequency until one or the other of the modes shows up. If the plate is twice as long as it is wide, the parallel to grain ( 0,2 ) mode will nearly always be at a higher frequency than the cross grain ( 2,0 ) mode. My experience has been that the twisting ( 1,1 ) mode is generally lower than the cross grain ( 2,0 ) mode but others often find the opposite. If only two of the three modes show up, then searching below 50 Hz is necessary.
Let’s review the equation for determining Young’s modulus dynamically. In this example we are calculating Ex, Young’s modulus parallel to grain. The appropriate equation is:
Ex = ( density*Lx^4*fx^2 ) / ( 384*1.05*d^2 ) (1)
where
Ex = Young’s modulus, parallel to grain, psia
density = weight / ( Lx * Ly *d)
Lx = the length of the plate parallel to grain, inches
fx = the frequency of the 0,2 mode parallel to grain
d = thickness of plate/beam, inches
Ly = width of the plate (across the grain), inches
Those using the mks system of units can convert the Young’s modulus in psia to N/m2 by multiplying by 6895.
Figure 4. Nodes formed for the 0,2 mode 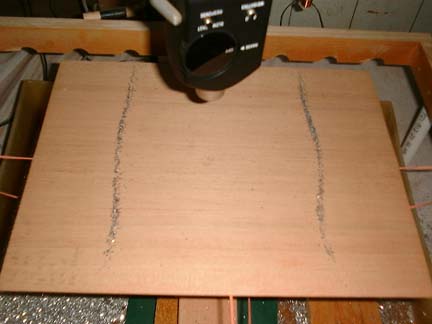
Figure 4 shows a pair of 0,2 nodes formed on a Douglas fir plate at 105 Hz. A node is an area of minimal vibration at a resonant frequency. In order to have the nodes show up clearly, the speaker needs to be placed in the center of the area of greatest vibrational amplitude, the mode or anti-node. The glitter bounces most vigorously in the modal area and the nodal lines are thinnest when the resonant frequency is reached. If you have difficulty making this judgment, the sound level meter shown in Figure 4 will be helpful. Position the meter several inches above and in the middle of the modal area. Adjust the sound level sensitivity to that point where the peak value goes to ~ mid scale as you sweep the frequencies across the resonant zone. That point where the sound level is maximum as shown by the meter is the resonant frequency.
Figure 5. Nodes formed for the 2,0 mode 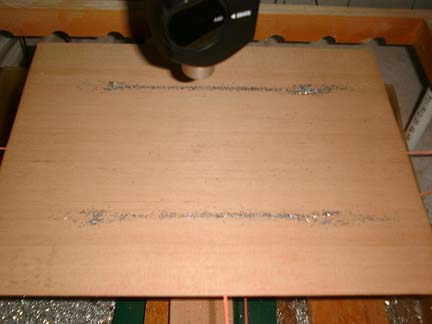
Figure 6.Nodes formed for the 1,1 mode 
Figure 5 shows a pair of 2,0 nodes formed at 75 Hz and Figure 6 a pair of 1,1 nodes formed at 35 Hz. The speaker can remain in the center of the plate to show the 2,0 nodes but both speaker and sound level meter must be moved to one of the corner quadrants to show the 1,1 nodes clearly.
O.K., let’s try a set of sample measurements. Here are the data for the plate shown in Figures 4, 5 and 6: Lx = 14.0 “; Ly = 10.75″; d = 0.102”; fx = 105 Hz; fy = 51 Hz; fx,y = 35 Hz; weight = 0.277 lbs. Please refer to the spreadsheet CalderPlateModes.xls for this example.
CalderPlateModes (to download double-click or option-click)
Cells for user input are colored light blue; values calculated using these data are colored light green. In the first row of calculated values the spreadsheet shows density, and the three Young’s moduli in both English and Metric notation. In this calculation example, the mass density of the sample is 4.72×10⁻⁵ lbm/in3 and the Young’s moduli for this plate are Ex = 1.83×10⁶ psia, Ey = 1.50×10⁵ psia and Ex,y = 1.20×10⁵ psia. In Metric notation, the density of the sample is .502 kg/m3 and the Young’s moduli for this plate are Ex = 1.26×10¹⁰ N/m2, Ey = 1.03×10⁹ N/m2 and Ex,y = 8.26×10⁸ N/m2 .
The second row of calculated values shows what may be useful information for the builder. The first column gives the ratio of Ex/Ey , which gives a sense of the relative stiffness in the along grain and cross-grain directions. Since the lower bout of the top of guitar family instruments is generally circular, there will be an alternating series of resonant frequencies dependent on either the cross-grain or parallel to grain stiffness or some combination of the two. The spacing of these frequencies will depend on both Ex and Ey as well as the bracing and bridge.
The second column gives the estimated length ratio wherein the 0,2 and 2,0 modes occur at the same frequency and form either an X or a “ring”. How can this happen? If we re-arrange equation (1) and solve for frequency:
fx = [ (384*1.05*d^2 *Ex )/(density*Lx4 ) ] ^1/2 (2)
we see that the frequency of the parallel to grain 0,2 mode is dependent on length, thickness and density. But if we keep density and thickness constant, then changing the length will directly affect the frequency. The relationship with the parallel to grain ( 2,0 ) is similar:
fy = [ ( 384*1.05*d2 *Ey )/( density*Ly4 ) ] 1/2 (3)
To determine what length ratio will result in the “ring” mode, we set the right hand sides of equations (2) and (3) equal to one another, square both sides, divide both sides by (384*1.05*d2), and multiply both sides by density. The resulting equation is:
Ey /Ly^4 = Ex /Lx^4 (4)
or,
Lx/Ly = ( Ex / Ey ) ^1/4 (5)
In this case, when Lx is 1.87 times longer than Ly , the “ring” mode will form. In my “pineapple” shaped ukuleles, the back is X braced and by feathering the four ends of the braces first and then gradually reducing the height of the central portion, you can obtain both a “ring” mode and the frequency you’re after. That the pineapple shape is usually not too far from the ratio where the “ring” would naturally form, it’s not too hard to make it happen. A circle is much more difficult and on a free top guitar plate, a bracing style used by Jeremy Locke seems necessary to beef up the cross-grain stiffness if you want to obtain a ring mode on a top that hasn’t been attached to the sides.
The third, fourth and fifth columns allow the user to play with the top thickness’ a little. That is, if the user usually uses wood with a final thickness of 0.08″ and an Ex of 1.5×10^6 for his instruments (as shown in the example), those values are entered into the third and fourth columns and the fifth column then shows how thick the piece of wood under study should be to achieve the same dynamic stiffness parallel to grain.
The next section on the spreadsheet (Calculated values necessary for Frequency Matrix Estimations and Frequency Matrix… ) deals with predicting the various combinations of vibrational modes on the plate under study. The equations and variables are described in Caldersmith, Graham (1984) Vibration Theory and Wood Properties, J. Catgut Acoustical Society, # 42, pp. 4-11. I used his equation (16) in each cell of the matrix. I put this in here to give the reader some sense of the number and variety of vibrational modes below 1000 Hz in a free plate, and also to see the type of distributions of modes which are created by different Young’s modulus ratios.
I enjoy writing these pages and hope that they are interesting and useful to the reader. I’ve stopped weaving/building at this time and still need to generate some income in order to continue to expand this website with more useful articles. If this page was helpful to you and you would like to make a $10.00 donation in order to have more pages like it, please use the donation button below. Thank you.