Effects of Humidity Changes on the Mechanical Stability of Instrument Tops
If you enjoy the technical side of things, please consider buying my book “Left-brain Lutherie” which you can buy directly from me.
I think we’ve all seen instruments come into the shop with cracks on the top resulting from a variety of reasons: abuse, poor bracing or building design, and the combined effects of temperature and of humidity. This page focuses on the last topic — the effects of humidity on the mechanical stability of instrument tops. We will first briefly review the effects of changing humidity conditions on the dimensions of wood; then consider how wood fails (breaks) under conditions of compression and tension; then consider the conditions of wood on an instrument top; and finally try to predict when a top might fail as a result of changing humidity conditions.
Discussion of each of these topics will necessarily be brief. For additional discussion, data and proofs of equations the reader is referred to the following sources: “Wood Handbook: Wood as an Engineering Material”, Forest Products Laboratory, USDA, Agriculture Handbook # 72, rev. August 1974; “Understanding Wood”, R. Bruce Hoadley, Taunton Press, 1980; “Roark’s Formulas for Stress & Strain”, Warren C. Young, McGraw-Hill, 6th ed.; “Mechanics of Materials”, James M. Gere and Stephen P. Timoshenko, PWS Pub. Co., 1997. I am indebted to Professor Josh Gordis of the Naval Postgraduate School for the donation of the last book to my research library.
When a live tree is harvested, it contains both free and bound water and is in its uniform, fully swollen size. If the wood were then stored in an open building at ~100% humidity, all of the free water would eventually be lost and only the bound water remain. This condition is called the Fiber Saturation Point (FSP). The amount of water in the wood at the FSP is about 28-30 wt% for nearly all types of wood. Interestingly enough, the dimensions of the wood wouldn’t have changed much yet, if my understanding of the process is correct. Only when bound water is removed do the dimensions of the wood begin to decrease. If we remove all of the bound water, then the piece of wood will also have shrunk as much as it can without the application of external force by a clamp or some such. The oven dry condition is the reference point for the smallest that the wood can become as a result of humidity changes. The dimensional changes from the 100% bound water condition (FSP) to the 0% water condition are what are traditionally given in data tables.
But the reality of wood storage conditions is that the relative humidity is somewhere between 0% and 100%; the amount of water in the wood will vary predictably as a function of the relative humidity. Figure 1 shows the relationship between the Equilibrium Moisture Content (EMC) in wood and the Relative Humidity (RH) using data from the “Wood Handbook”.
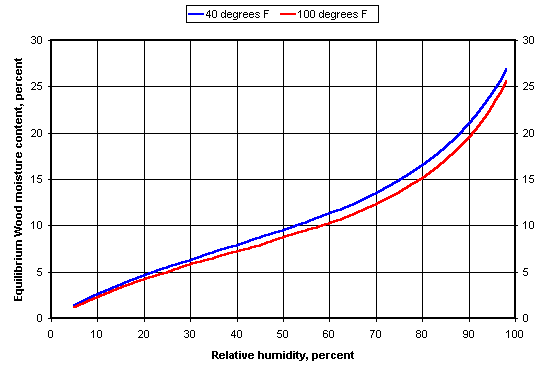
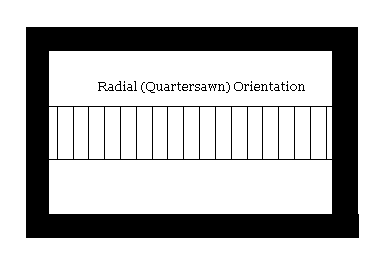
I keep my shop at a relative humidity of ~ 50%. If the wood in my shop is at equilibrium, then its EMC should be about 9%. It’s interesting that there is so little temperature effect on the EMC. The lines shown here are for 40 degrees F (blue) and 100 degrees F (red), the probable working temperature range for most luthiers.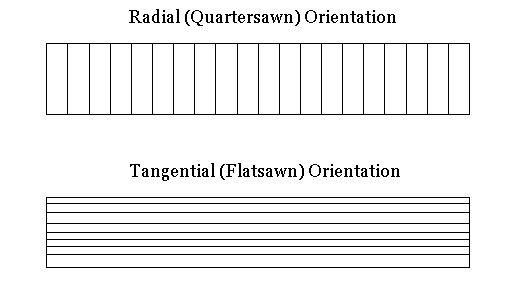 A given piece of wood will shrink different amounts depending on the orientation of the grain. Imagine looking at the end of a 1″x6″ with the 6″ width being horizontal. If the annual rings are at right angles to the width of the board the grain orientation is termed radial (also called quartersawn). If the annual rings are now ~ horizontal, the grain orientation is termed tangential (also called slab cut). In the tangential (slab-sawn) orientation, the board width will show the greatest dimensional changes when the relative humidity changes.
Table 1, below shows average shrinkage values for a number of common top woods. Radial (quartersawn) dimensional changes are about half of that of tangential (flatsawn) changes for the same amount of relative humidity change. Most tops are radially (quartersawn) oriented. I have also included values of Young’s Modulus, E, parallel to grain for the purpose of later calculations.
Table 1. Radial and Tangential Shrinkage from Green to Oven-dry Moisture Content for Common Instrument Top Woods. 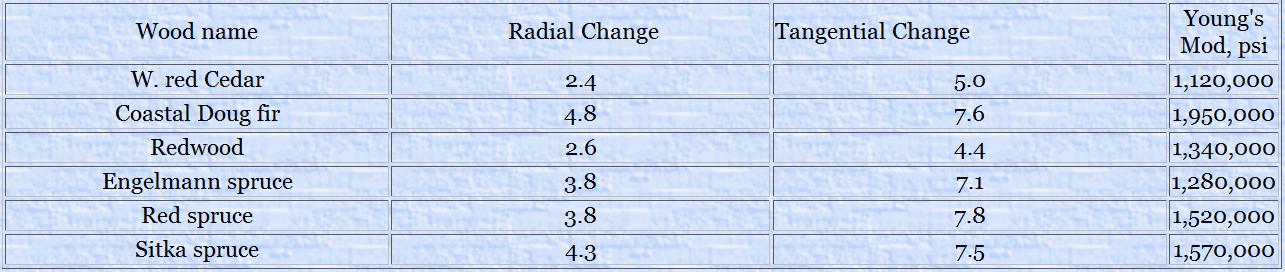
But how do we begin to relate this shrinkage information to changes in relative humidity? As seen in the “Wood Handbook” and “Understanding Wood”, we make a plot of EMC vs. Shrinkage. In the graph below, I’m using values close to those of red spruce in the table above. In this plot the vertical axis will be the same as the previous plot for reasons which will become clear shortly.
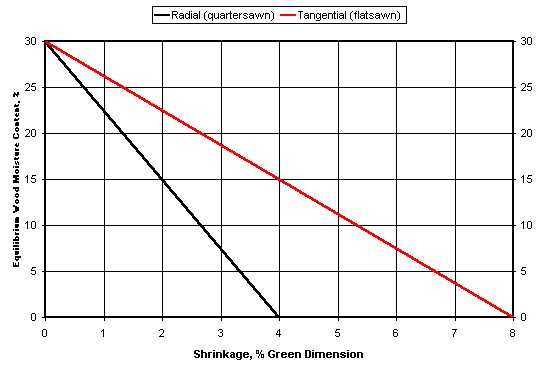
In this figure we note that as EMC decreases , the % shrinkage increases. That is, as the wood gets drier, it becomes shorter in both the radial and tangential directions. The amount of tangential change (red line) is about twice that of radial change (black line) in the example above. Now we need to relate linear change to relative humidity change since the latter is much simpler to measure in the shop.
What we’re going to try to do in this example is begin with a relative humidity value and then get to a shrinkage number. On a warm, humid, summer day, we could expect the local humidity in an un-air conditioned wood shop to be about 80%. In the left figure above, on the horizontal axis, go upward from the 80% value until you reach the red line, then go across to the right vertical axis. A 80 % relative humidity value gives a 15% EMC. If we continue across to the right figure along the same EMC value until we intersect the radial (quartersawn) shrinkage line, and then go downward vertically to the shrinkage axis we get a value of ~ 2.0%. So for a relative humidity of 80%, the radial (quartersawn) orientation of the red spruce in this example has shrunk ~ 2.0% from the green state.
So, what if the wood is stored at 80% relative humidity (EMC = 15%) and then is moved to a location where the relative humidity is 25% (EMC = 5%)? How much will a given piece of wood change its dimensions? The approximate formula in “Understanding Wood”, Chapter 6 is:
Length change = (original length)*(total shrinkage %)*(EMC change/FSP) (1)
The total shrinkage % refers to the radial or tangential shrinkage for each wood type; FSP is the fiber saturation point as discussed above. So, for radial shrinkage, the above change in conditions, and using the decimal equivalents of per cent:
Length change = (original length)*(0.04)*( (.15-.05) /.30) = (original length)*(0.013)
This means that a 10″ long piece of radially oriented wood would shrink ~ 0.13″, and the same length of tangentially oriented wood would shrink ~0.26″!
In properly constructed furniture, the various parts of the piece are so constructed as to be able to move freely with changes in relative humidity. In contrast, the top of a musical instrument is constrained by being glued to the sides. The top of an instrument built at high relative humidity will be in tension at low relative humidity; conversely, the top of an instrument built at low humidity will be compressed at high relative humidity.
Wood is less resistant to failure (breakage) in tension than compression. This is shown in Table 2 below for the same wood species as in Table 1.
Table 2. Selected Mechanical Properties for Common Instrument Top Woods at 12% EMC from Table 11, Chapter 6, “Understanding Wood”.
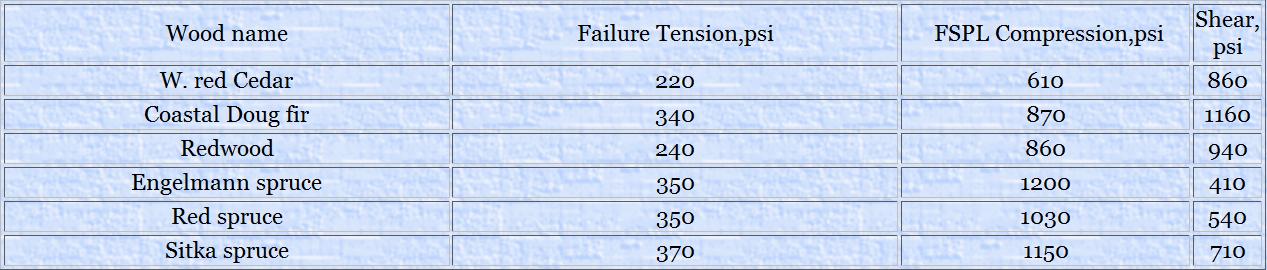
These tests require some clarification. The compression values are those reached at FSPL (Fiber Strength at Proportional Limit). In compression and tension there is a linear region of the stress strain curve where, when the stress is removed, the material returns to its original dimensions. Beyond this point permanent deformation or breakage of the material occurs; there will be some recovery from deformation when the stress is removed but not back to the original dimension. So the FSPL represents the point of permanent wood deformation. The tension values represent actual wood failure. Both the compression and tension values are perpendicular to grain. The shear data are also for actual wood failure and are for tests parallel to grain. These tests are described in considerable detail in “Understanding Wood”, Chapter 6. For our red spruce example, a tension of 350 psi across the grain will break the wood; in comparison, any compression beyond 1030 psi across the grain will begin to permanently deform the wood.
We are now going to do a thought experiment. Let’s take a strip of wood and fix it into a metal framework as shown below. The metal framework will keep the wood from changing its length during humidity changes. Relative to our previous discussion of dimension changes resulting from humidity changes, let’s fix it into the frame when it is equilibrated at a relative humidity of 80%. Let’s now put it into a 20% relative humidity environment and calculate the resulting tension.
It can be shown (“Mechanics of Materials, Chapter 2, Section 5) that the amount of stress built up in the wood is approximately equal to the product of the proportional change in length of the wood (percent change expressed as a decimal) if it weren’t constrained times the Young’s modulus. That is,
Stress = (decimal proportional length change)*(Young’s Modulus) (2)
Our fractional length change from earlier calculations is ~0.013. But the Young’s Modulus given in Table 1 is for stiffness along the grain. Typically, cross grain stiffness is 5-20 times lower than along the grain. For argument’s sake, let’s use an estimate of ten times less. So we now estimate that the red spruce across grain Young’s modulus is 152,000 psi. Therefore the tensile stress in the wood is:
Stress = (0.013)*(152,000 psi) ~= 2000 psi
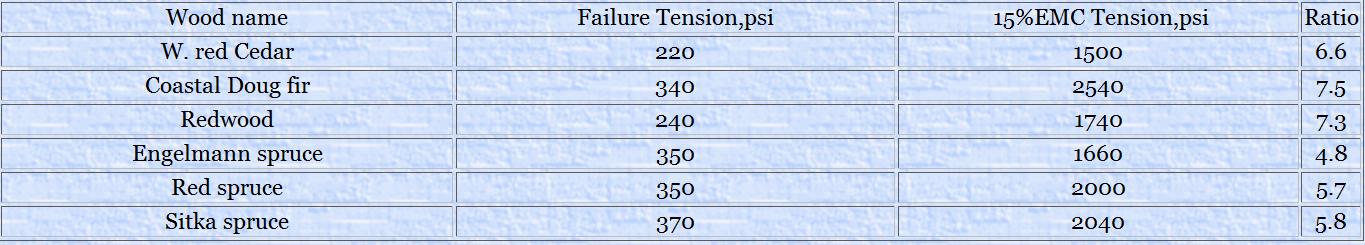
This value is ~ 6 times the measured radial wood failure value of 350 psi! It is very likely that in this simple set of conditions, the wood constrained by the frame would have broken under this much tension. Table 3 gives a set of calculations for the woods in Table 2 showing the basic failure values under tension, the amount of tension calculated for a 15% EMC change and the ratio of the two numbers.
Table 3. Amount of tension needed to cause wood failure, increase in tension resulting from a 15% EMC decrease and ratio of tension change to tension failure for several common guitar family top woods.
The ratio column in Table 3 is a rather sobering comment on the stresses created by allowing an instrument to be built in somewhat humid summer conditions and then transferring it to lower humidity winter conditions. The figure below shows the estimated tensile stresses calculated from changes in EMC for different values of Young’s Modulus perpendicular to grain.
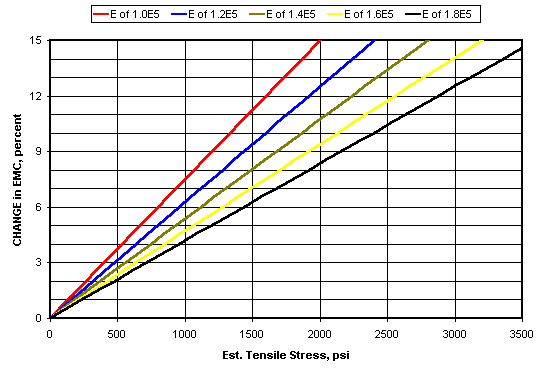
Looking at the figure, we can see that in principle only a 2-4% change in EMC is enough to equal the tensile stress fracture point for all woods.
It’s also important to point out at this point the importance of the bridge patch in preserving the integrity of the top. The pull of the strings is rotating the bridge in a direction parallel to grain. This rotation creates a shearing force which is focused at the ends of the bridge. If the top is in tension across the grain, it will be that much easier for the shear forces to fracture the wood unless these forces are distributed over a wider area by the bridge patch. I have discussed this point on the page dealing with Bridge Sizes and recommend that page to the reader for further consideration.
What if we reverse the building conditions and build in a dry environment (25% Relative Humidity) and move to a more humid environment (80% Relative Humidity)?
Table 4. FSPL compressive stresses from Table 2, the estimated compressive stress from the humidity change and that ratio of the two. 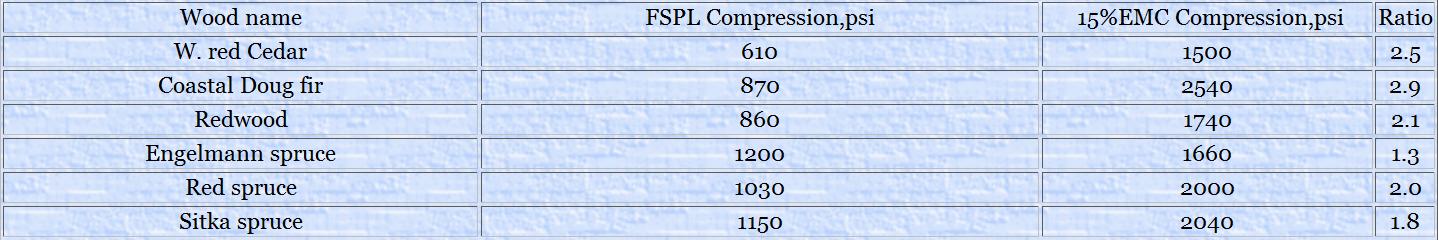
In nearly every case, the FSPL limit is exceeded by a factor of 2-3, suggesting permanent wood deformation for nearly all the woods in this example.
At this point, it’s interesting to consider why instruments which are routinely subjected to large changes in EMC don’t fall apart more frequently. At this point, I would guess that the internal bracing and the bridge act as agents for restricting lateral movement. The more diagonally the braces are oriented, the more resistent to movement the top will be.
I suggest that another important and more subtle construction feature is the arch of the top of the instrument. That is, if the instrument is somewhat arched, then tensile stresses might try to flatten the arch before splitting the wood. Conversely, compressive stresses would simply make the arch somewhat greater.
It is also possible that the instrument sides might “give” slightly in response to stresses, but they are constrained by the orthotropic nature of the wood. In general, longitudinal dimensional changes along the grain are about 1% when going from the green state to oven dry. Across the grain radial changes are several times greater than along the grain changes. Imagine a set of sides which have been joined by the heel and tail blocks (but without top or back). Pressing inward or pulling outward at the waist causes the body length to increase or decrease. But when the front and back are on and expanding to different degrees in different directions, the whole system is much stiffer; altering the arch of the top and back or wood failure may be the only actual options.
More discussion to follow as a result of reader input. Stay tuned…
I enjoy writing these pages and hope that they are interesting and useful to the reader. I’ve stopped building at this time and still need to generate some income in order to continue to expand this website with more useful articles. If this page was helpful to you and you would like to make a $5.00 donation in order to have more pages like it, please use the donation button below. Thank you.